LC-MS/MS Based Peptide Mapping following Trypsin Digestion of Proteins using Capillary Columns
Patrik Appelblad, PhD
Analytical Chemistry R&D, Merck Life Science AS, Norway
Abstract
This study employs a two-dimensional liquid chromatography (2D-LC) approach, utilizing both reversed-phase liquid chromatography (RPLC) and zwitterionic hydrophilic interaction liquid chromatography (ZIC®-HILIC), combined with Time-of-Flight Mass Spectrometry (TOF-MS) detection, to analyze trypsin-cleaved proteins, including bovine serum albumin (BSA), cytochrome C, and ovalbumin. The results demonstrate that trypsin digestion of proteins generates smaller peptides suitable for mass spectrometric analysis, with the dual-column strategy significantly enhancing chromatographic resolution and selectivity, leading to improved peptide identification and characterization. The findings highlight the complementary nature of RPLC and ZIC®-HILIC in capturing a broader range of peptide properties, revealing distinct peptide patterns and modifications that are critical for understanding protein behavior in complex biological matrices. This comprehensive approach underscores the effectiveness of capillary LC-MS/MS in proteomics, facilitating high-resolution analysis and deeper insights into protein structure and function.
Section Overview
Introduction
Characterizing proteins is crucial for understanding their roles in health and disease. Proteins can form large, complex structures, and variations in their amino acid sequences can occur due to improper assembly, degradation, or post-translational modifications. Identifying intact proteins using a single analytical method is challenging due to their high molecular mass and complexity. Peptide mapping, which involves cleaving proteins into smaller fragments for analysis, allows for the determination of amino acid sequences and protein identification through chromatographic separation and comparison with reference standards. This technique can also assess protein quality by detecting alterations such as amino acid misincorporation and modifications like glycosylation. Developing a peptide mapping identity test requires understanding the specific application and characteristics of the test protein to ensure sufficient specificity and validation of the analytical method, and there are a few important points to be considered, such as sample pretreatment, digestion (cleavage technique), separation, detection, and data analysis.
The choice of cleavage technique for protein digestion is dependent on the specific protein and involves various enzymatic and chemical agents, each with distinct pH and temperature requirements that impact effectiveness and reproducibility. Factors such as digestion time, enzyme-to-protein ratio, and the stability of peptides must be carefully considered to optimize the digestion process while minimizing side reactions and artifacts. Additionally, precautions must be taken to avoid autolysis of enzymes, which can introduce extraneous peaks in the peptide map, necessitating the use of modified enzymes or specific pH conditions to inhibit enzyme activity during preparation. Trypsin, for example is a serine protease, it effectively digests proteins at the carboxyl side of arginine and lysine residues, producing smaller peptides suitable for mass spectrometric analysis, which reveals insights into protein structure and function. Trypsin is highly specific, and it is only impaired if an acidic residue is on either side of the cleavage site or a proline residue is on the carboxyl side.
Mass spectrometry (MS) combined with liquid chromatography (LC), in general, is a powerful combination of separation power and detection capabilities, enabling sensitive and specific identification of complex protein mixtures. Time-of-Flight Mass Spectrometry (TOF-MS) is furthermore a mass spectrometric sub-technique that measures the mass-to-charge ratio of ions by accelerating them through a voltage field and detecting the time it takes for them to reach a detector. This allows for high-resolution and accurate mass measurements, making it particularly useful for characterizing complex mixtures such as peptides. TOF-MS is preferred for peptide mapping procedures due to its high sensitivity and ability to generate accurate mass measurements, which are crucial for determining the amino acid sequences of peptides. Additionally, its rapid analysis time allows for efficient processing of samples, making it suitable for high-throughput applications in protein characterization.
The combination of capillary LC and TOF-MS has become prominent in proteomics due to its ability to analyze low sample volumes while maintaining high resolution and sensitivity, facilitating the characterization of peptides in complex biological matrices. Additionally, employing complementary/orthogonal chromatographic principles and using both reversed-phase (RPLC) and zwitterionic (ZIC®) hydrophilic interaction liquid chromatography (HILIC) columns provide both enhanced chromatographic resolution and selectivity, maximizing the overall analytical efficiency. This orthogonal combination enhances coverage of a 2D separation space, making it particularly effective for characterizing complex tryptic digests. This study presents data from the analysis of trypsin-cleaved proteins; bovine serum albumin (BSA), cytochrome C, and ovalbumin using 150 x 0.3 mm I.D. C18 and ZIC®-HILIC columns combined with TOF-MS detection.
Experimental
Reagents and Materials
Formic acid (for LC-MS) and acetonitrile (LC-MS grade) were from Merck Life Science KGaA, Darmstadt, Germany (operating as MilliporeSigma in the US and Canada), and the high-purity water was delivered by a Milli-Q® system and had an electrolytic conductivity of less than 60 nS/cm.
Samples
Three in-house prepared freeze-dried digests, i.e., tryptic digest of cytochrome C (equine heart, 12 kDa, 500 pmol), tryptic digest of Ovalbumin (Chicken egg white, 45 kDa, 500 pmol,), tryptic digest of bovine serum albumin (BSA, 68 kDa, 500 pmol) were each dissolved in 50 µL mobile phase with initial gradient profile composition in their test tubes. The samples were then allowed to mix thoroughly prior to analysis. All samples were filtered through a 0.45 µm PVDF filter prior to use.
Chromatographic System
The chromatographic system consisted of a capillary HPLC system, where the analytical separations were carried out on a 150 x 0.3 mm I.D. fully porous silica particle (FPP) capillary column having an octadecylsilica (ODS, C18, RP-18) stationary phase attached to 5 µm particles with 300 Å pores and a 150 x 0.3 mm I.D., SeQuant® ZIC®-HILIC capillary column having the stationary phase attached to 5 µm particles (FPP) with 200 Å pores (150481-U). 10 pmol of each digested sample were injected (1 µL) via the autosampler using µL-pick-up technique. Gradient separation was performed in both RP and HILIC dimensions, and the flow rate was set at 7 µL/min for the ODS capillary column, while it was at 5 µL/min for the SeQuant® ZIC®-HILIC capillary column. The applied gradient profiles are illustrated in Tables 1a and 1b.
Capillary HPLC Gradient profiles
The applied RP and HILIC column gradient profiles are illustrated below. All eluents were filtered through a 0.45 µm PVDF filter (HVLP04700) and degassed by purging with helium for 15 minutes prior to use. Mobile phase A consisted of water with a 0.25% formic acid (FA), while mobile phase B consisted of acetonitrile with a 0.25% formic acid (FA).
Mass Spectrometric Detection
The mass spectrometric analyses were performed on an MicroMass Ultima-QTOF mass spectrometer. Needle voltage of 3.1 kV, and cone voltage of 45 V was applied, while the collision energy was set to 10V to achieve intact molecule ions and less fragmentation. The scan range was m/z 300-1800 using a cycle time of 1.5 seconds for all experiments using the ODS (C18) column, while the scan range was m/z 400-1800 using a cycle time of 1.5 seconds for all experiments using SeQuant® ZIC®-HILIC columns.
Results & Discussion
The application of capillary LC-MS/MS for the characterization of trypsin-cleaved proteins demonstrates the technique's effectiveness in analyzing complex protein mixtures. The use of trypsin digestion facilitated the generation of smaller, more manageable peptides, subjected to both RPLC and HILIC separations for complementary chromatographic resolution. A dual-column approach significantly improved the resolution and selectivity of the analyses, allowing for a comprehensive assessment of the peptide profiles, as shown in Figure 1.
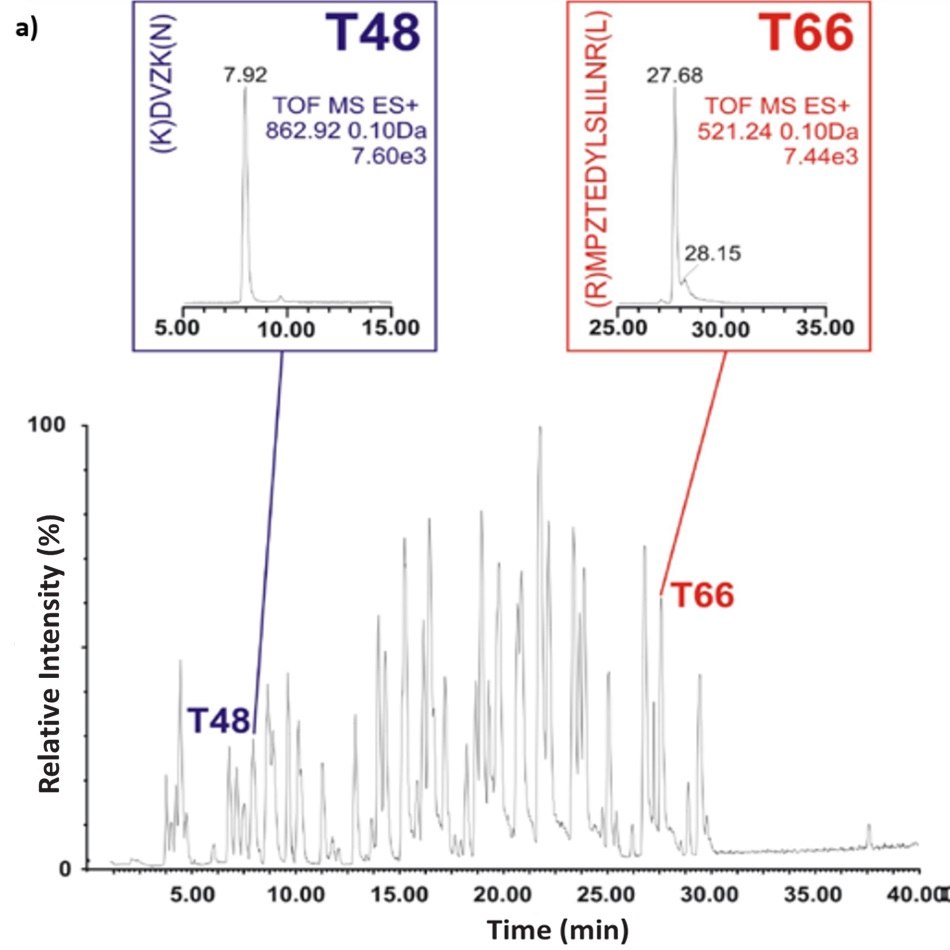
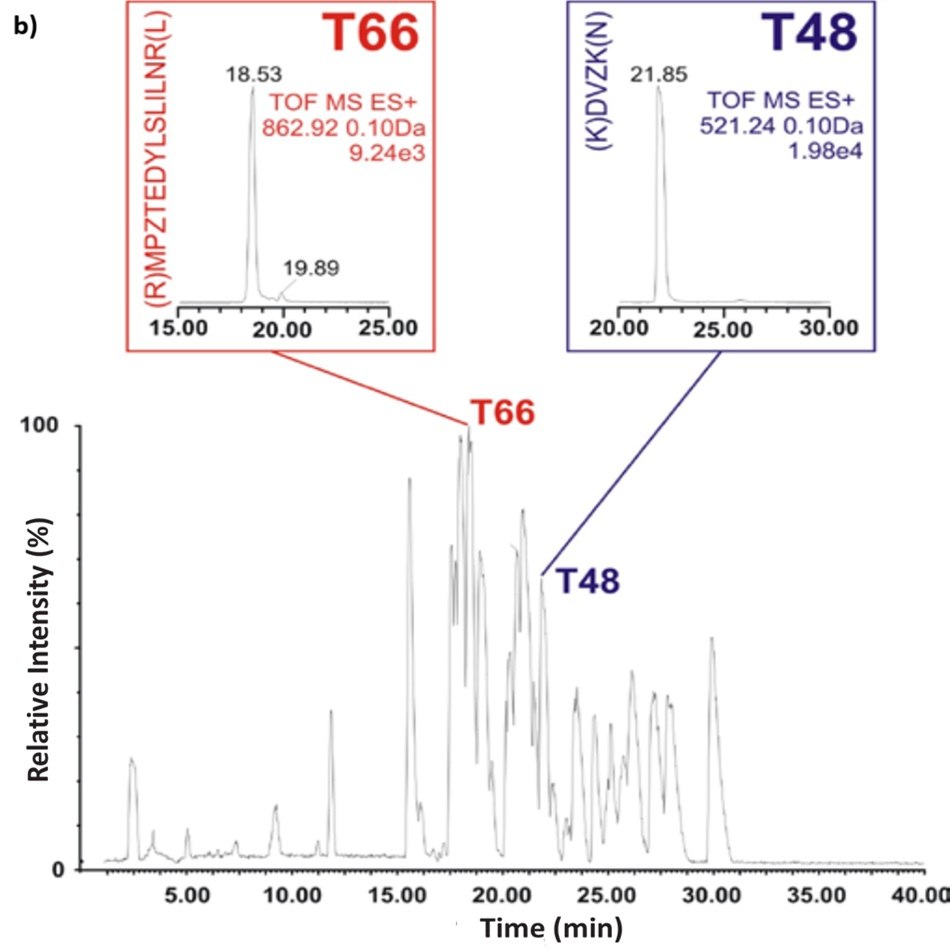
Figure 1. Base peak intensity (BPI) chromatograms show peptide maps of the BSA tryptic digest using C18 RPLC (left) and ZIC®-HILIC (right) gradients. Inserts show the ion chromatograms of two peptide fragments T48 and T66, (K)DVZK(N) and (R)MPZTEDYLSLILNR(L) respectively. T48 is a smaller peptide fragment with a molecular weight of 520.23 and where T66 has a molecular weight of 1723.23 (but detected as M+2R ion).
In the case of BSA, the ZIC®-HILIC and C18 RPLC analysis revealed in both chromatographic dimension’s, Figures 2-3, rich spectra of peptides, yet overall, with a higher sequence coverage and resolution in the RPLC mode. Figures 4-6 illustrate the benefit of combining results of the two complementary chromatographic gradient methods with TOF-MS detection in Selected Ion Monitoring (SIM) mode. SIM is a mass spectrometry technique to enhance the sensitivity and specificity of analyte detection while filtering out other ions, allowing for the detection of low-abundance compounds in complex mixtures. By concentrating on specific ions, SIM improves the signal-to-noise ratio, making it particularly useful for quantifying trace levels of target analytes. The results from analyzing fragments T10, T48, and T66 highlight difference both in elution pattern between HILIC and RP mode as well as overall sensitivity.
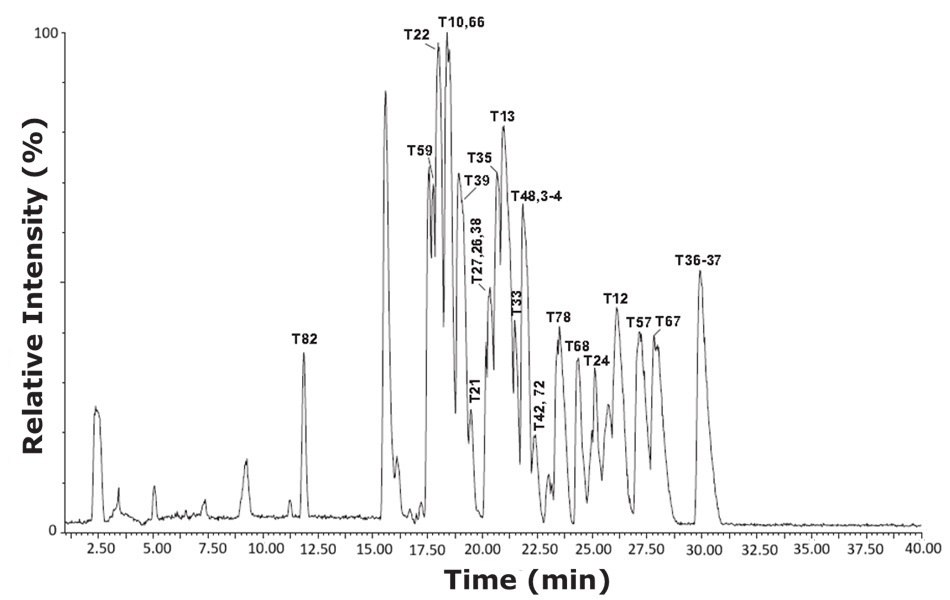
Figure 2.Base peak intensity (BPI) chromatogram of tryptic peptides from bovine serum albumin (cow) using the HILIC mode gradient conditions.
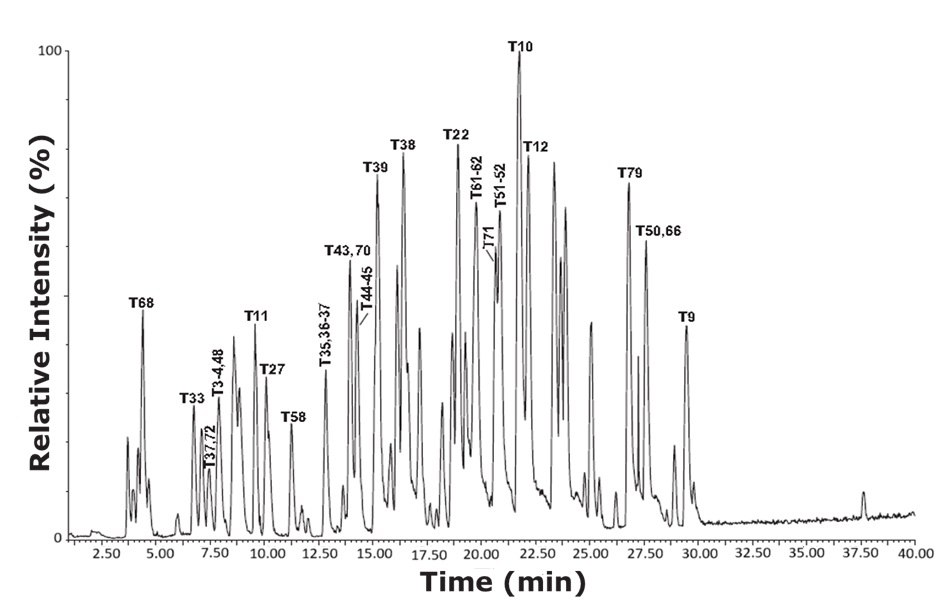
Figure 3.Base peak intensity (BPI) chromatogram of tryptic peptides from bovine serum albumin (cow) using the RPLC mode gradient conditions.
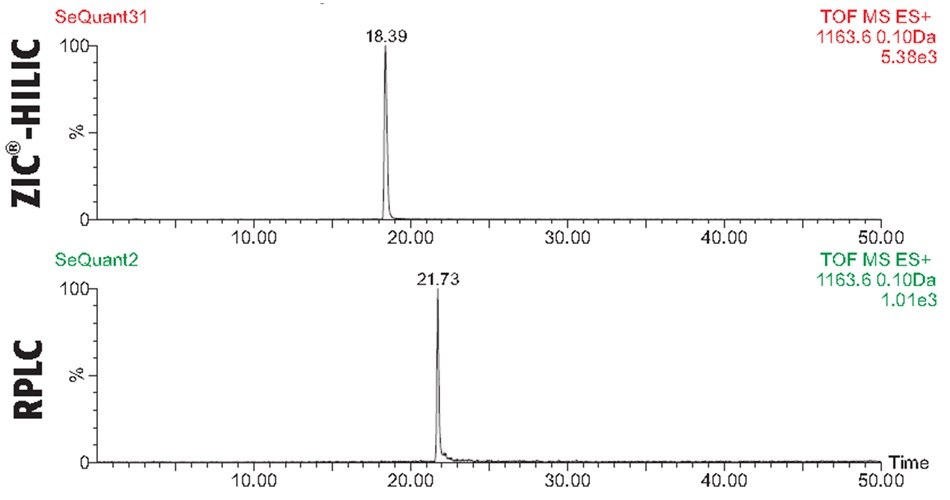
Figure 4.Comparison of Selected Ion Monitoring (SIM) spectra for trypsin-cleaved BSA peptide fragment T10, with sequence (K)LVNELTEFAK(T), analyzed with C18 RPLC and ZIC®-HILIC columns using MS-TOF detection. The RPLC mode shows greater retention time for T10, indicating its stronger interaction with the C18 stationary phase. In contrast, the ZIC®-HILIC data demonstrates five times higher sensitivity for T10, allowing for better detection of lower abundance levels.
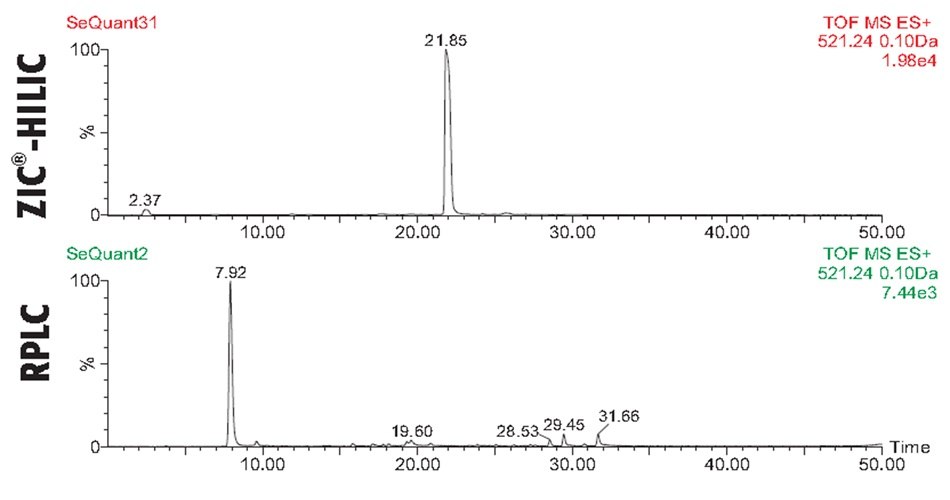
Figure 5.Comparison of trypsin-cleaved BSA peptide fragment T48 analyzed with C18 RPLC and SeQuant® ZIC®-HILIC columns using MS-TOF detection and Selected Ion Monitoring (SIM). The HILIC mode shows both greater retention for T48, as well as 2.5 times higher sensitivity for T10, allowing for better detection of lower abundance levels.
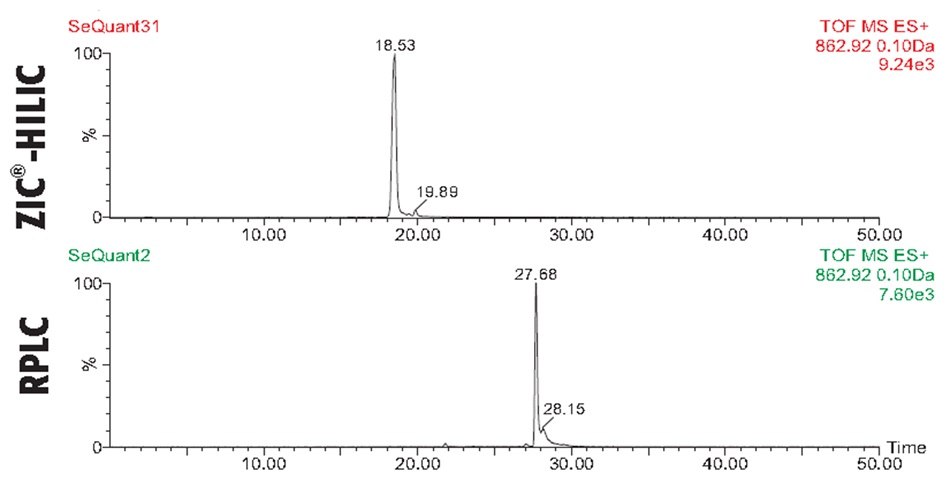
Figure 6.Comparison of trypsin-cleaved BSA peptide fragment T66 analyzed with C18 RPLC and SeQuant® ZIC®-HILIC columns using MS-TOF detection and Selected Ion Monitoring (SIM). The RP mode shows greater retention for the T66 fragment, and both chromatographic methods provide a comparable sensitivity.
Similarly, trypsin-cleaved cytochrome C and ovalbumin exhibited distinct peptide patterns in both RPLC and HILIC mode, illustrated in Figures 7-8. The orthogonal separation techniques allowed for the identification of peptides that may play critical roles in immunogenicity and allergenic responses. Overall, the findings in this study underscore the power of capillary LC-MS/MS in proteomics, particularly when utilizing complementary chromatographic techniques to achieve high-resolution analysis of complex biological samples.
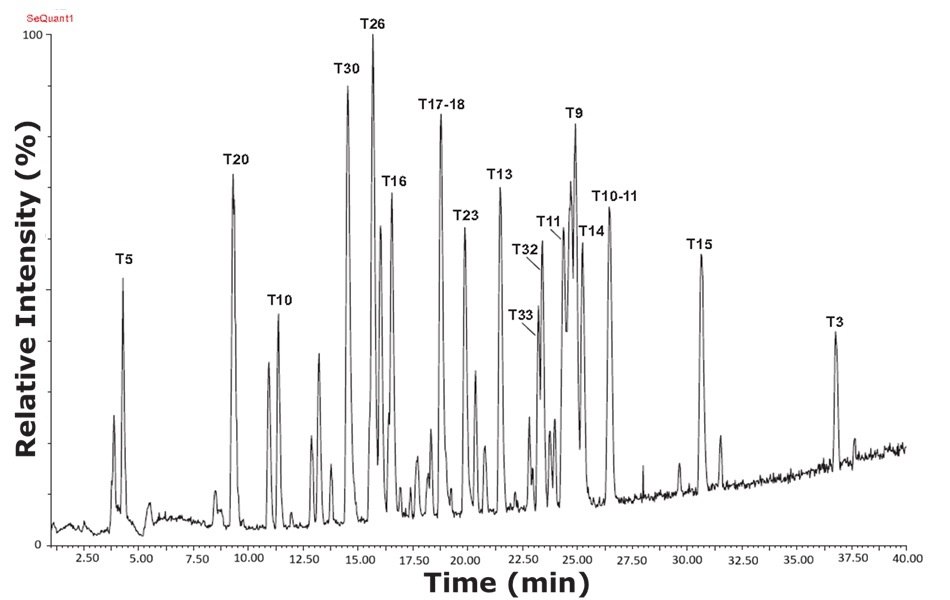
Figure 7.Base peak intensity (BPI) chromatogram of tryptic peptides from a sample containing trypsin-cleaved ovalbumin, analyzed with a RPLC column and using MS-TOF detection. The digested ovalbumin sample expressed more peaks and higher resolution using the reversed phase column compared with HILIC mode.
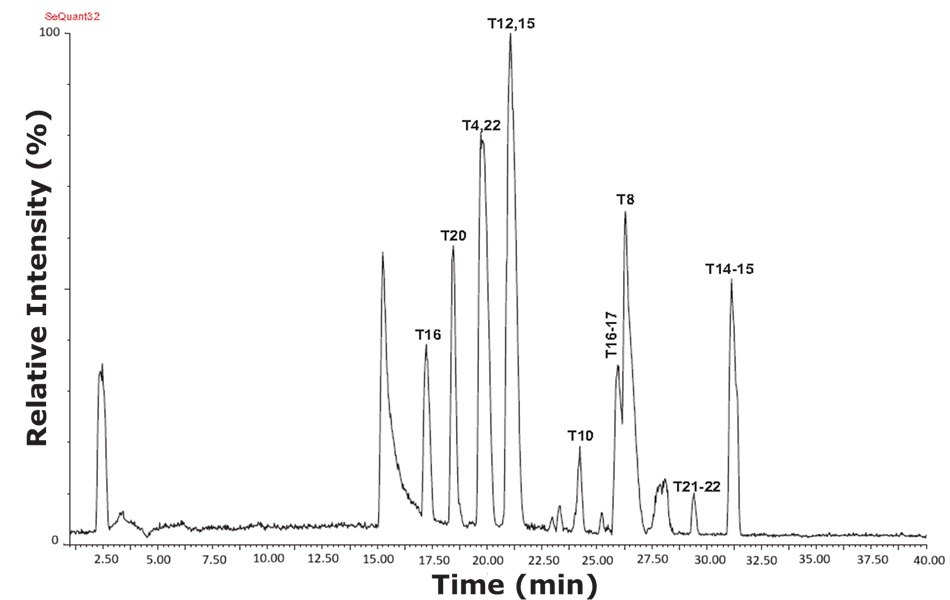
Figure 8.Base peak intensity (BPI) chromatogram of tryptic peptides from a sample containing trypsin-cleaved cytochrome C, analyzed with a SeQuant® ZIC®-HILIC column and using MS-TOF detection. The digested cytochrome C sample expressed more peaks and higher resolution in the HILIC mode than under reversed phase conditions.
Conclusion
Using a zwitterionic HILIC column in conjunction with a C18 RPLC column for a two-dimensional (2D) liquid chromatography approach enhances the characterization of trypsin-cleaved proteins by leveraging the complementary separation mechanisms of both columns. The zwitterionic (ZIC®) HILIC column effectively retains hydrophilic peptides and provides improved resolution for polar modifications, while the C18 column excels in retaining hydrophobic peptides, facilitating a comprehensive analysis of the protein digest. By employing respective gradient separation methods, this complementary selectivity approach allows for the efficient separation of a broader range of peptide properties, enhancing sensitivity and specificity in LC-MS/MS characterization, ultimately leading to more detailed insights into protein structure and modifications. In fact, with a SeQuant® ZIC®-HILIC column, some hydrophobic peptides could be identified that could not be detected (they were too retained) with the RP column.
Find more tools for LC-MS analysis.
To continue reading please sign in or create an account.
Don't Have An Account?