Cell Proliferation EdU Assay for Enhanced DNA Synthesis Detection
Section Overview
- Introduction
- Applications and Scientific Use Cases
- Experimental Protocol
- Conclusion
- Related Products
Introduction
Cell proliferation involves de novo DNA synthesis during the S-phase of the cell cycle. Detecting this process is critical across various research areas, including cell health monitoring, genotoxicity testing, and assessing the impact of therapeutics on cell cycle progression. Historically, DNA synthesis was measured using [³H] thymidine incorporation, followed by scintillation counting or autoradiography. While effective, this method is time-consuming, requires radioactive materials, and demands specialized equipment. A widely adopted alternative is BrdU (bromodeoxyuridine) labeling, where BrdU incorporates into DNA and is detected via anti-BrdU antibodies. However, this approach requires DNA denaturation, adding complexity and potentially compromising sample integrity.
To address these limitations, our EdU (5-ethynyl-2’-deoxyuridine) cell proliferation assays offer a faster, more efficient solution. Unlike BrdU, EdU detection uses click chemistry, enabling direct, antibody-free labeling of newly synthesized DNA with fluorescent dyes. The result is a streamlined protocol that reduces assay time and is compatible with fluorescence microscopy, flow cytometry, and high-throughput screening platforms.

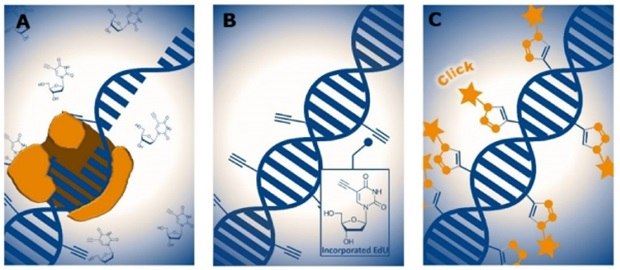
Figure 1.EdU-based DNA labeling during cell proliferation. (A) EdU is incorporated into DNA during the S-phase as a thymidine analog, (B) EdU incorporated DNA identifiable by their terminal alkyne groups for detection, (C) Detection of incorporated EdU via click chemistry using fluorescent azide dyes. Orange stars represent the fluorescent labels bound to EdU sites.
Applications and Scientific Use Cases
In vitro Applications
The EdU assay has broad applications across both in vitro and in vivo systems. It enables researchers to:
- Quantify cell proliferation in adherent and suspension cultures.
- Assess the effect of experimental treatments (e.g., small molecules, gene editing).
- Measure IC50 values in drug screening assays.
- Visualize proliferative zones in tissues, including brain, intestine, and lymphoid organs.
- Monitor developmental proliferation patterns in model organisms.
In vivo Applications
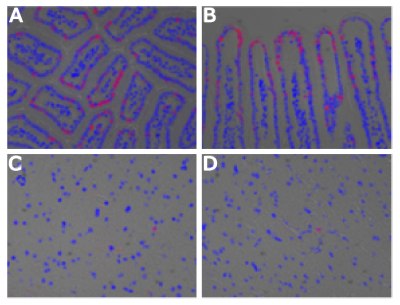
A notable application includes its use in vivo murine models, where EdU injected intraperitoneally is selectively incorporated into dividing lymph node cells. Studies demonstrated that EdU remains non-toxic at doses up to 25 mg/kg and labels only actively proliferating cells without affecting non-dividing tissues like the brain or liver.

Figure 2.Labelling of DNA in vivo inside of a model mouse utilizing EdU by Salic and Mitchinson: (A and B) The small intestine of a mouse. Villi are shown A) as a cross-section and B) as a longitudinal section. (C and D) The brain of a mouse.
Experimental Protocol
EdU Incorporation Assay Workflow
Step 1. Seed and grow cells: Prepare the cells for EdU labeling by seeding them based on the intended application.
- Coverslips: For imaging applications using fluorescence microscopy.
- Microplates (e.g., 96-well plates): For high-throughput screening (HTS) workflows, compatible with automated platforms.
- Culture dishes or flasks: For flow cytometry applications
Step 2. Sample treatment & immunostaining (optional): Apply treatments to modulate cell behavior before EdU incorporation or stain surface markers before fixation. Common treatments include:
- Small molecules (e.g., drugs or inhibitors) to modulate cell behavior.
- Gene silencing agents, like siRNA/shRNA to knock down specific gene expressions.
- Cytokines, growth factors, or toxins, depending on experimental design.
Step 3. Incubate cells with EdU: Label proliferating cells by incorporating EdU during DNA synthesis.
- Add EdU to the culture medium at a typical concentration of 10 µM.
- Incubate for 1–2 hours or as optimized.
Step 4. Additional sample treatment (optional): Stain for surface or intracellular markers to enable multi-parameter analysis.
- Surface antigens: Stain before fixation to preserve cell surface epitopes.
- Intracellular targets: Stain after permeabilization, typically post-fixation, to detect internal proteins or transcription factors.
Step 5. Application-specific processing
(A) Imaging (e.g., Fluorescence Microscopy): Visualize EdU-labeled cells on coverslips.
- Fix cells (commonly using paraformaldehyde).
- Permeabilize cells (e.g., with Triton X-100) to allow reagent access.
- Perform the click chemistry reaction using an azide-conjugated fluorophore (e.g., Alexa Fluor azide) that covalently binds to EdU.
- Wash and mount coverslips.
- Analyze under a fluorescence microscope.
(B) High-Throughput Screening (HTS): Quantify EdU incorporation using automated platforms.
- Fix and permeabilize cells in microplates.
- Perform the click reaction with an azide dye in the well.
- Analyze with a plate reader, imaging system, or other HTS-compatible readout platforms (e.g., high-content screening).
(C) Flow Cytometry (FC): Quantify EdU-positive cells in suspension.
- Harvest cells gently (e.g., using trypsin or EDTA-based methods).
- Fix and permeabilize cells in tubes or plates.
- Perform the click reaction with an azide dye (fluorescent label).
- Wash and resuspend cells in buffer.
- Analyze on a flow cytometer to quantify the percentage of EdU-positive cells and optionally co-stain with cell cycle or activation markers.
Note: EdU Cell Proliferation Kit is fully compatible with additional immunostaining techniques, allowing researchers to simultaneously analyze cell proliferation alongside phenotypic or functional markers.
Step-by-Step Guide: Using the EdU Assay Protocol Across Applications
- Seed and grow cells on coverslips (microscopy), microplates (HTS), or culture dishes/flasks (flow cytometry).
- Optional: Treat cells with small molecules, inhibitors, or other agents.
- Incubate with EdU (10 µM) for 1–2 hours.
- Fix cells using 4% paraformaldehyde in PBS for 15 minutes.
- Permeabilize cells with appropriate reagent; wash for 20 minutes.
- Prepare click reaction cocktail (reaction buffer, azide dye, copper catalyst, and additive).
- Incubate with click cocktail for 30 minutes in the dark.
- Wash cells with 3% BSA in PBS.
- Optional: Perform additional staining (e.g., immunostaining, metabolic labeling).
- Analyze using fluorescence microscopy, flow cytometry, or a plate reader.
Conclusion
The EdU Cell Proliferation Assay Kit provides a sensitive, non-radioactive method for detecting DNA synthesis. Ideal for applications in oncology, regenerative medicine, pharmacology, and developmental biology, it offers low toxicity, supports multiplexing, and serves as a superior alternative to traditional BrdU-based assays.
EdU Cell Proliferation Assay for High-throughput Screening
EdU Cell Proliferation Assay for Flow Cytometry
References
To continue reading please sign in or create an account.
Don't Have An Account?